


Most financial products optimize for attention. Freeport was built around a different bet: that our news feed should not only inform users but also help them act faster and more precisely. A question that we care about, then, is not merely whether the feed is engaging and fun, but also if users who trade through it actually make money.
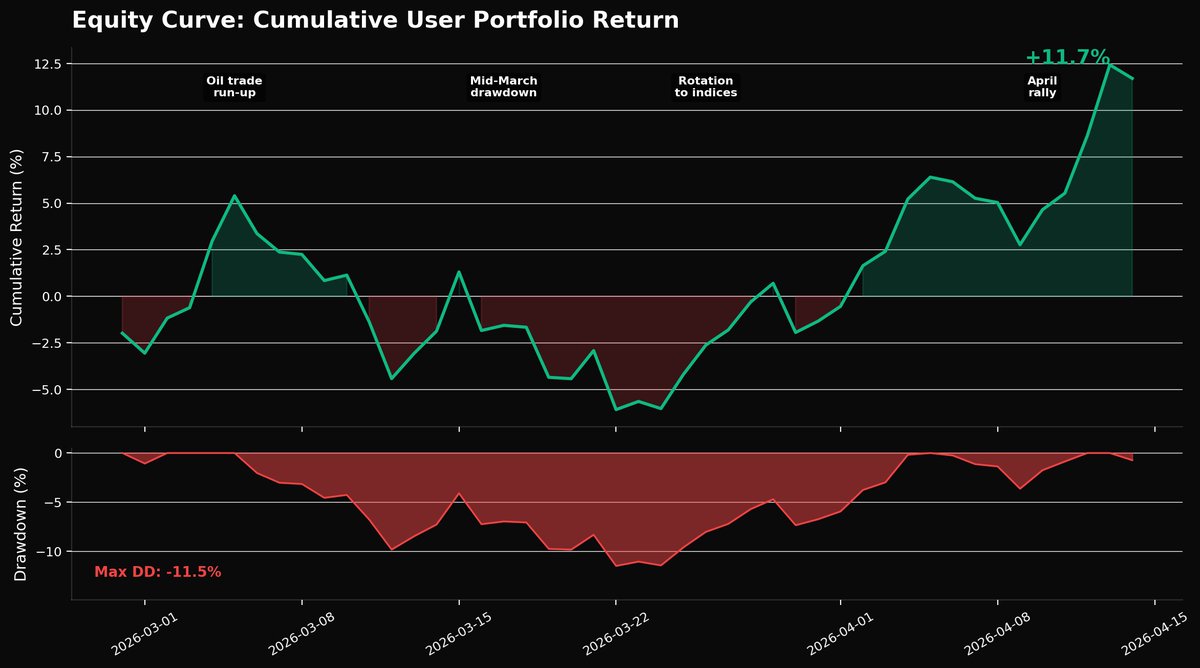
In the 45 days since launch, the early answer is encouraging. Freeport users have generated roughly $27 million in trading volume across indices, commodities, single stocks, crypto, and pre-IPO tokens. On a money-weighted basis, aggregate user returns stand at 11.7%. That number is a meaningful result, but it is not, by itself, proof of anything. This essay is about being honest about what it does and does not show.
What Our Users Traded
The first thing that stands out in the data is what users chose to trade. Here is the breakdown by share of cumulative volume:

Users are not speculating on meme-coins, but instead trading the kind of real assets that populate the books of global macro hedge funds and commodity trading advisors.
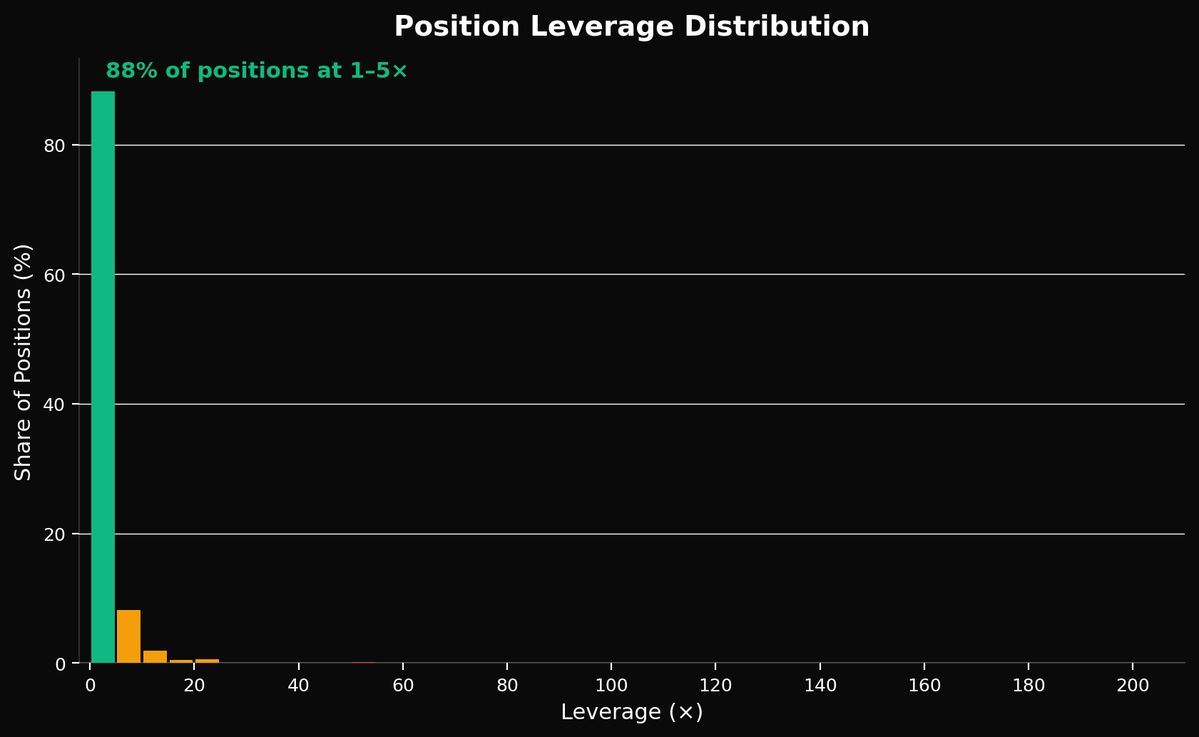
Just as notable is the leverage discipline. Average leverage across the user base sits in the 2-4x range, far below the 10-200x maximums the platform allows. That is the kind of measured sizing one would expect from someone expressing a market view with a defined risk budget.
Trading Conflict Escalation
Numbers without context are difficult to interprete. To understand why users made money, we need to understand the macro environment they traded through and how they responded to it in real time.
Freeport launched amid rising middle-eastern tensions on Feb 28 when the United States and Israel launched airstrikes on Iran, assassinating Supreme Leader Ali Khamenei and other Iranian officials. Over the new few weeks WTI crude moved from the low $60s to above $100.
During this time, the app's feed surfaced conflict headlines from newswire sources (@zerohedge, @DeItaone, @unusual_whales) within milliseconds of publication. Users who recognized the implications went long oil via perpetual futures and captured a substantial portion of the move.

What may be surprising is that the majority of oil-regime PnL actually came from users who entered hours and days later as the escalation deepened. In other words, most of the money was not made on the initial headline but rather the sequence of escalations that came after. Each new development pushed crude higher, and users who read the feed's real-time coverage recognized that each event made the next escalation more likely.
Were our users merely lucky or is it actually the case that present news has implications for future news that the broader market has not yet digested? Research suggests that the latter is possible through a mechanism closely related to post-earnings announcement drift (PEAD), where Bernard and Thomas (1989, Journal of Accounting and Economics) showed that investors systematically underreact to the serial correlation in earnings surprises. In our case, the "earnings surprise" is a geopolitical escalation, and the under-reaction is the market's failure to price in that one tariff action raises the probability of the next.
More generally, one can argue that users were exposed to event-driven momentum, the kind that Hong and Stein (1999, Journal of Finance) predict should generate persistent returns when information diffuses slowly across investor populations. The theoretical mechanism is straightforward: not all market participants see the same information at the same time, and those who see it first can position before the market fully adjusts. Freeport's feed compresses the information lag. Users who acted on it were, in effect, trading against slower participants.
Trading Peace Rumors
The other major contributor to portfolio PnL was the de-escalation trade, and it is worth explaining in detail, because what users didn't do matters as much as what they did.
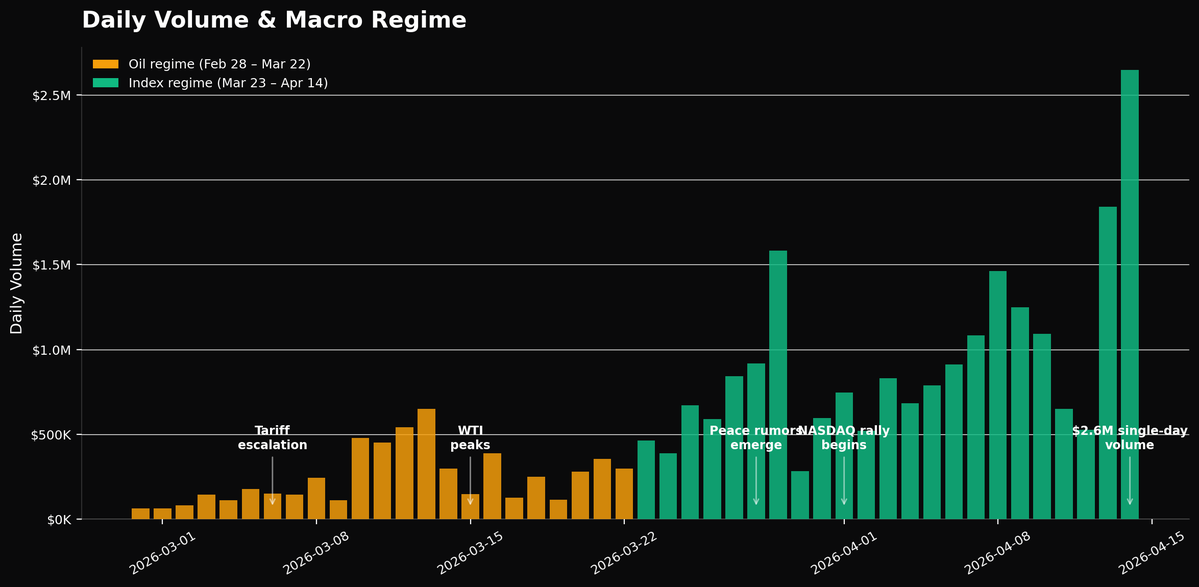
When diplomatic channels reopened in late March, the obvious trade was to short oil. But that is not what happened on Freeport. Users overwhelmingly went long NASDAQ and S&P instead. In the following days, the NASDAQ 100 rallied approximately 15% off its March lows.
This may partially be due to the architecture of the feed recommender, as Freeport's recommender engine is biased towards not suggesting shorts (unless the best expression of the trade is indeed to short) but rather to long anti-correlated assets (in this case equity indicies). This is because financial media has a well-documented negativity bias; Tetlock (2007, Journal of Finance) showed that negative media content predicts downward pressure on market prices, but the effect reverses because the negative framing systematically overstates actual deterioration. Headlines skew negative. But equities climb walls of worry.
We also want to be honest about the counterfactual: we do not know what would have happened if the feed had surfaced oil-short analysis instead. Users might have shorted crude and still made money; or they might have gone long equities anyway, on their own conviction. What we can say is that the feed's editorial weighting toward index-long analysis coincided with PnL contribution from NASDAQ and S&P longs in late March and April being the single largest driver of aggregate returns in the second regime.
Decomposing the User Returns
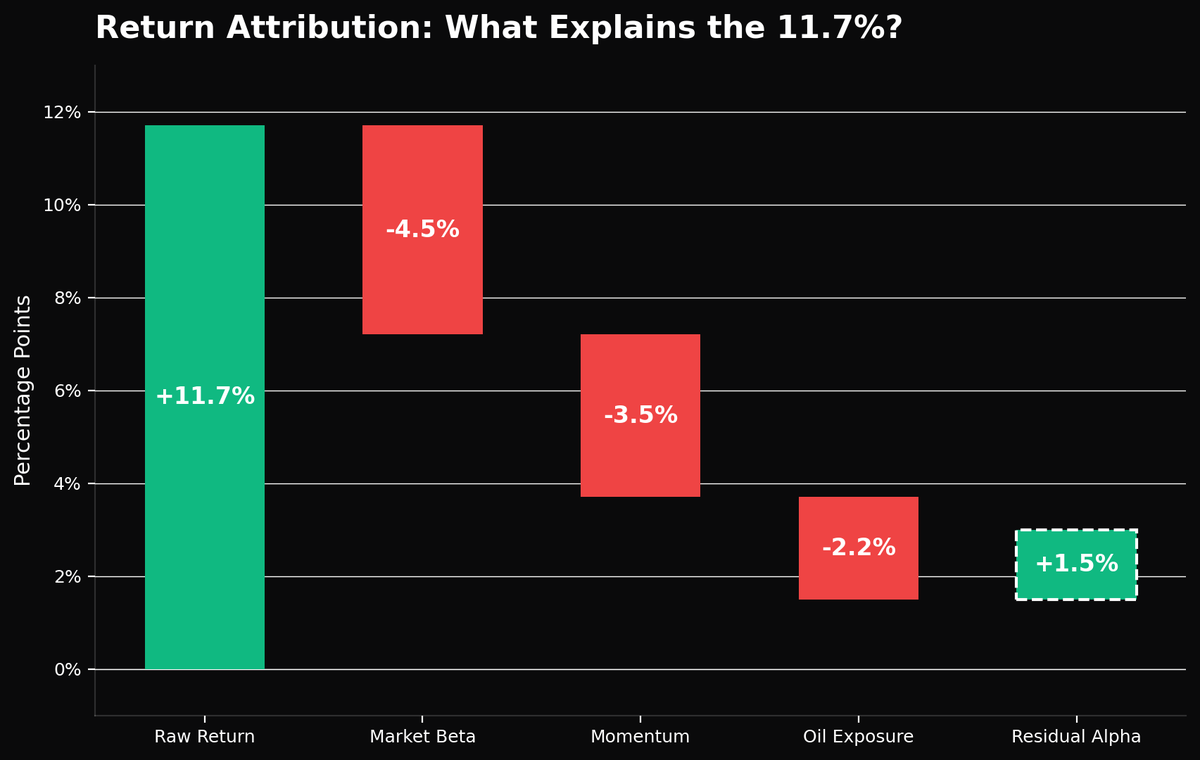
Claiming 11.7% in 45 days and walking away would be intellectually dishonest. So let us break it down. There are three obvious contributors, and a positive residual.
Market Beta: Approximately 4-5% Contribution
The S&P 500 is up from the date of Freeport's launch, Freeport acquired more users over time, and those users had meaningful equity exposure; NASDAQ 100 and S&P 500 perpetuals together accounted for 33% of volume. Some portion of the 11.7% aggregate return is simply "the market went up and users were long."
This is real. We do not hide it. If you are long equities during a period when equities rally, you will make money regardless of skill. A basic beta adjustment suggests that roughly 4-5 percentage points of the 11.7% return can be attributed to broad market exposure.
Short-Term Momentum: Approximately 3-4% Contribution
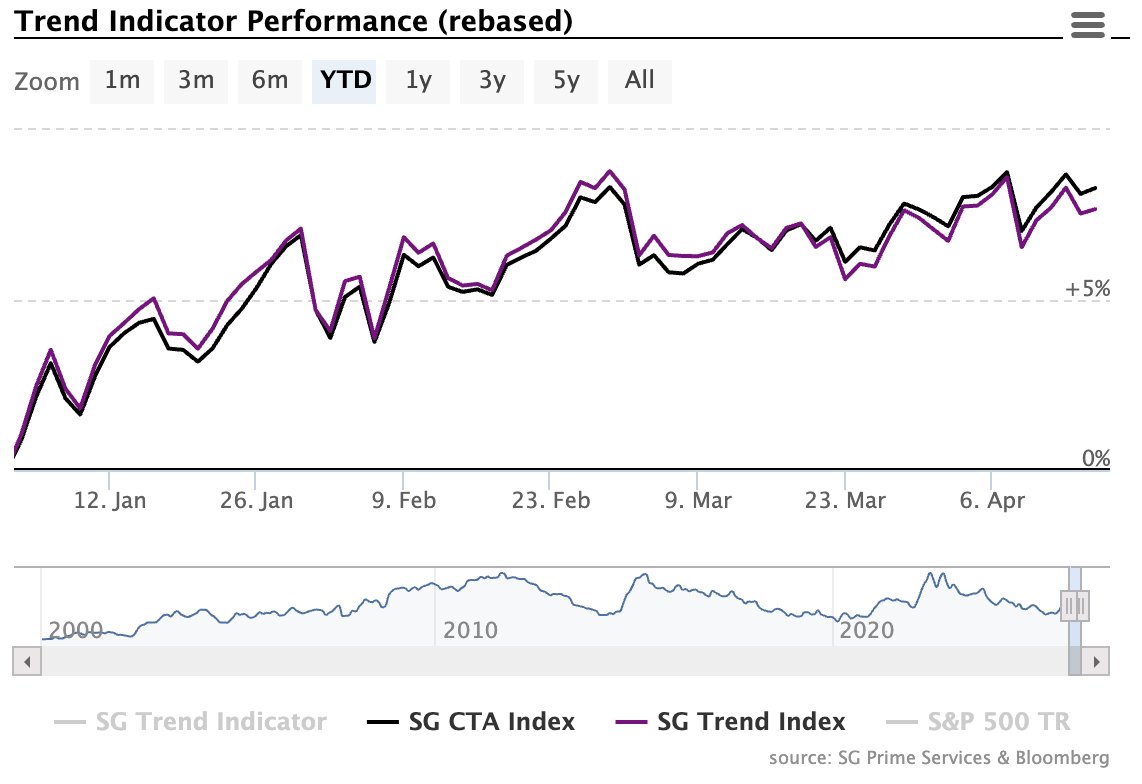
Users traded in the direction of recent price moves. When oil was going up, they went long oil. When indices were rallying, they went long indices. This is momentum; the most robust anomaly in empirical finance, documented by across more than three decades of data. Both the SG CTA Index and the SG Trend Index, broad measures of performance based on trend-following and momentum strategies, has performed well over the last few months.
We separate the momentum component from discretionary timing using a standard factor regression. Whatever the factors explain is mechanical, users were long things going up, whatever they do not explain is the residual, which captures rotation timing, position sizing, and the decision of which momentum signals to follow and which to ignore. The split is roughly 3.5 points momentum, 4.5 points market beta, and 3.7 points residual. The residual is not statistically significant on 46 days of data, but it is economically meaningful.
Oil Concentration: Approximately 2-3% Contribution
WTI crude was 15% of total volume, and oil had a strong directional move during the first half of the period. Concentrated exposure to an asset that moves 15-20% will mechanically contribute several percentage points to aggregate returns. This is real and we flag it explicitly.
Residual: Approximately 2-3% Contribution
After controlling for beta, momentum, and oil concentration, some return remains. The residual is positive. But the t-statistic is approximately 0.3. That is not statistically significant by any conventional standard.
However, it is economically meaningful. Even a percentage point of excess return over 45 days, if sustained and repeatable, would annualize to a figure that exceeds most hedge fund performances. And the mechanism is plausible: faster information leads to faster action, which captures the early portion of a price move before slower market participants adjust (this is especially true when trading using onchain rails overnight or over the weekend, when prices are much less efficient).
This is not a novel claim. Jame, Johnston, Markov, and Wolfe (2022, Journal of Financial Economics) found that Seeking Alpha research articles made retail order flow more predictive of future returns and cash-flow news. The mechanism is identical: curated, high-quality analysis helps investors make better-informed trades. Freeport's feed is the same mechanism accelerated; verified sources, AI-filtered for actionable signals, with one-tap execution from the feed itself.
What the Best Traders Had in Common
The top 25 users by PnL, representing roughly 1% of the trading base, generated a combined money-weighted return of 18.2% over the 45-day period. We analyzed some aspects of their behavior to see what sets them apart from the broader cohort.
First, they traded less often than the typical active user; averaging 2.1 trades per day on days they traded versus 5.8 for the median user actively trading on that day. In addition, the top users were more disciplined with leverage, with a median leverage of 2.4× versus 3.3× for the full population. Their median holding time was 31 hours versus 19 hours, letting winners run. Therefore, it can be argued that selectivity and patience were the dominant predictors of outperformance.
This is the behavior Freeport is designed to encourage. We do not want users to follow signals blindly or overtrade on every headline. The product is built to empower users with curated analysis, timely notifications when prices move or events unfold, and direct links to the sources and reasoning behind each alert, so that users can apply their own judgment.
When we design the product, we think explicitly about the difference between empowering users versus exploiting them. Every social media feed in existence optimizes for time spent. We want to optimize for results, because we know that we can't build something lasting if it actively harms.
That means fewer notifications, not more. It means surfacing why something matters, not just that it happened. It means giving users the context to decide not to trade at times, because the best traders in our data sat out more often than they acted. We believe the best trading app is the one that makes you a better trader, not the one that keeps you glued to a screen. Forty-five days of data suggests that philosophy is working. We intend to keep proving it.